GERS 2016-17: A Journey in Graphs
From the archive — published in 2017 on the original Chokkablog, kept as it was written.
Today saw the publication of the Government Expenditure & Revenue Scotland (GERS) report for the fiscal year 2016-17. Regular readers of chokkablog will know what's coming next: I've churned the handle of my GERS Spreadsheet and here come the graphs ...Let's start with the simple headline fact: Scotland's GERS deficit was £13.3bn last year, a slight improvement on the previous year1.

As a percentage of GDP our deficit is now 8.3%. An improvement on last year but, to place this figure in context, the EU's "excessive deficit threshold" is defined as 3.0%2


At this point somebody normally pipes up that this proves the UK's economic strategy is failing Scotland because the UK as a whole is improving but Scotland isn't. This is of course a rather daft observation. It's daft because it doesn't allow for the impact of North Sea oil revenue declining due to the global oil price crash and maturing North Sea reserves.
North Sea oil revenues are now effectively zero3, as the OBR and many of us predicted some time ago. This of course contrasts rather dramatically with the £6.8 - 7.9bn annual North Sea income that the Independence White Paper recklessly predicted.
We can easily exclude the impact of this North Sea decline by looking at Scotland's onshore economy only (the green line below).

This shows that our onshore economy has in fact been improving broadly in line with the trend for the UK as a whole4.
"But hold on Kev" I hear you ask, "if it's all about the loss of oil revenues, surely that's a problem for the UK as a whole as well?". The answer to this is simply that the North Sea is proportionately way less important to the economy of the UK than it is to Scotland. Here's that same graph on a total UK basis - makes the point pretty clearly I think.

This is easily explained by looking at Scotland's revenue generation and expenditure (on a per capita basis) versus the rest of the UK. Regular readers will be familiar with this graph5. The figures below are all in real terms (i.e. adjusted by the UK GDP deflator).

As an aside, this set of GERS figures includes some significant revisions to previous years' figures - the previous year's published figures are shown dotted on the graph below

The most notable difference relate to oil revenues which have been revised down in recognition of the fact that the ONS accruals and estimation methodology is considered more appropriate than the previous methodology used6. I can only imaging the fury that would be unleashed from the pro-independence camp had a similar admission of historical revenue under reporting had been made.
This graph shows us:
- Red line: we consistently receive about £1,300 higher expenditure per capita than the rest of the UK
- Green Line: we consistently generate about £400 per capita less onshore revenue than the rest of the UK
- Black line: when you include oil revenue, we've historically generated considerably more revenue than the rest of the UK, sometimes (most recently 2011-12) enough that our higher revenue more than compensates for our higher spend.
The difference between the red and the black lines is our per capita deficit gap, the amount by which our per capita deficit exceeds (or not) that of the rest of the UK.
Here's an updated plot of this gap - the trend is clear.

When the SNP's Independence White Paper was written, the most recent available GERS figures were for 2011-12 and references were made to "the last five years" of GERS figures which I've highlighted in yellow. Because of the revisions to prior years that have since been made (most notably, but not only, the change to oil revenue assumptions) I thought it would be interesting to correct what the White Paper stated at the time:
When the SNP's Independence White Paper was written, the most recent available GERS figures were for 2011-12 and references were made to "the last five years" of GERS figures which I've highlighted in yellow. Because of the revisions to prior years that have since been made (most notably, but not only, the change to oil revenue assumptions) I thought it would be interesting to correct what the White Paper stated at the time:
Since 2007/08, Scotland has run an average net fiscal deficit ofIf the shoe was on the other foot I think I can safely say the nationalists would be up in arms about this. For what it's worth, I and others who paid attention had always argued that it was reasonable to assume the figures would if anything err on the side of generosity to Scotland - and I believe those compiling the data at the time acted in good faith. So if you're expecting a rant about these revisions, I'm sorry to disappoint.£8.3 billion£10.0 billion (5.9 per cent6.8 percent of GDP). [..] In 2011/12, the latest year for which data is available, Scotland is estimated have run a net fiscal deficit equivalent to5.0 per cent7.0 percent of GDP. In the same year the UK is estimated to have had a deficit of7.9 per cent7.1 percent of GDP.
What these graphs tell us - and what this blog has frequently argued - is that there's long been an onshore deficit gap of about £9.0bn between Scotland and the rest of the UK. This was simply masked by surges in oil revenue. When the oil revenue goes (as it has now), that deficit is exposed. The idea that oil was ever just "a bonus" for the independence case is risible.
What I personally hadn't appreciated until recently was that the Barnett Formula (which still underpins the Block Grant and largely determines Scotland's devolved budget) is currently actually acting to help increase Scotland's relative spend per capita. Although it was designed to reduce higher per capita spending in the devolved nations over time, the combination of relatively low absolute budget increases and slower population growth relative to England means the current impact is in fact the opposite. We see this empirically in the figures above, and in my recent blog on this subject I modeled how and explained why this happens

What I personally hadn't appreciated until recently was that the Barnett Formula (which still underpins the Block Grant and largely determines Scotland's devolved budget) is currently actually acting to help increase Scotland's relative spend per capita. Although it was designed to reduce higher per capita spending in the devolved nations over time, the combination of relatively low absolute budget increases and slower population growth relative to England means the current impact is in fact the opposite. We see this empirically in the figures above, and in my recent blog on this subject I modeled how and explained why this happens
There are arguments to be made for calculating the deficit gap either on a per capita or percent GDP basis and versus either the UK as a whole (including Scotland) or versus rUK (the rest of the UK). If you really care, you can read the arguments here (> FFA For Dummies; Methodology) but all you really need to know is it makes little difference. The graph below shows the size of this onshore deficit gap over time, calculated in both ways

We can safely say that, for the last decade and more, there's consistently been an £8 - 10bn onshore deficit gap between Scotland and the rest of the UK and there's currently no sign of it going away. This is the "black-hole" that some of us keep banging on about.
Let's clear a common point of confusion: the "black-hole" doesn't mean the deficit. It means the amount bigger our deficit would be than that we now share with the UK ... if we were independent and still raising and spending public funds at the rate shown in GERS.
This matters in part because we could continue our trajectory of onshore revenue growth and slower spending growth and eventually we would eliminate (or at least reduce to manageable levels) our deficit - but we wouldn't close the gap with the rest of the UK unless we raise revenues faster or increase spending more slowly than them. As long as we perform on the same track that gap remains - a gap that now translates into an effective fiscal transfer from the rest of the UK to Scotland of £10bn a year or £1,900 for every man, woman and child in Scotland.
Is it fair that we should receive that money? Well there are two ways of answering that.
Firstly you could argue that the principle of union is that we receive equal levels of service from the state (not equal levels of spending) and so if an area is high "cost-to-serve" it should receive more public funds. Think Scottish islands and rural areas being subsidised by Scottish cities. Scotland is high cost-to-serve relative to the rest of the UK because of low population density and dispersed communities, but also because we have health and demographic challenges (see Two Types of People).
Secondly you could argue that it's the quid pro quo for the fact that when we have a windfall like North Sea oil, we share it. We definitely did share it of course - if you start the clock in 1980 (the most favourable point to do so from Scotland's perspective) we can see clearly that for a long time Scotland was a massive net contributor to the UK's economy (when black line is above red - excuse my scruffy shading) .

For what it's worth, if you sum up the total real terms net contribution by Scotland to the UK over this time period we are still "in credit" by about £7k per capita (so at the current rate of transfer we'd still be in credit for another 3 years). Nobody in Scotland needs feel embarrassed by the fiscal transfer - we are pooling and sharing over time as well as geographically. Of course we could try and run this calculation from 1707, but that way madness lies.
Nobody is arguing that an independent Scotland wouldn't want to and indeed have to do things differently - but GERS does show us the starting point, the run-rate, the pro-forma accounts on which an independence case needs to be built.
As the SNP's Independence White Paper itself stated:
As the SNP's Independence White Paper itself stated:
Those who champion independence have to make a credible for case for how and why and by how much we'd change the GERS figures by being independent. Just saying "the GERS figures tell us nothing" simply doesn't wash - they tell us what happens if we were to keep taxing and spending at these levels (and why we can't)."The analysis in GERS is based on the current constitutional framework. However, it provides a useful indication of the relative strength of Scotland’s public finances as part of the UK and a starting point for discussions of Scotland’s fiscal position following independence" - White Paper p.596
So let's look at where we spend the money today: here's our total managed expenditure in real terms over the last 18 years

Of course some of that money is controlled by Westminster. In the cases of debt interest and defence these cost are allocated to us on a per capita basis. The other main reserved expenditure is elements of social security, most notably pensions, which are allocated on an actual spend basis.
Remembering that the value of the fiscal transfer from the rest of the UK to Scotland is £10bn, it's worth noting that if you (ridiculously) assume no debt and no defence costs at all we'd still be looking for £4bn a year if we were out of the UK and wanted to continue to spending these other sums (without running a greater deficit than that we share with the UK).
You're probably wondering in what areas are we spending more than the rest of the UK on a per capita basis? Well we have a graph for that
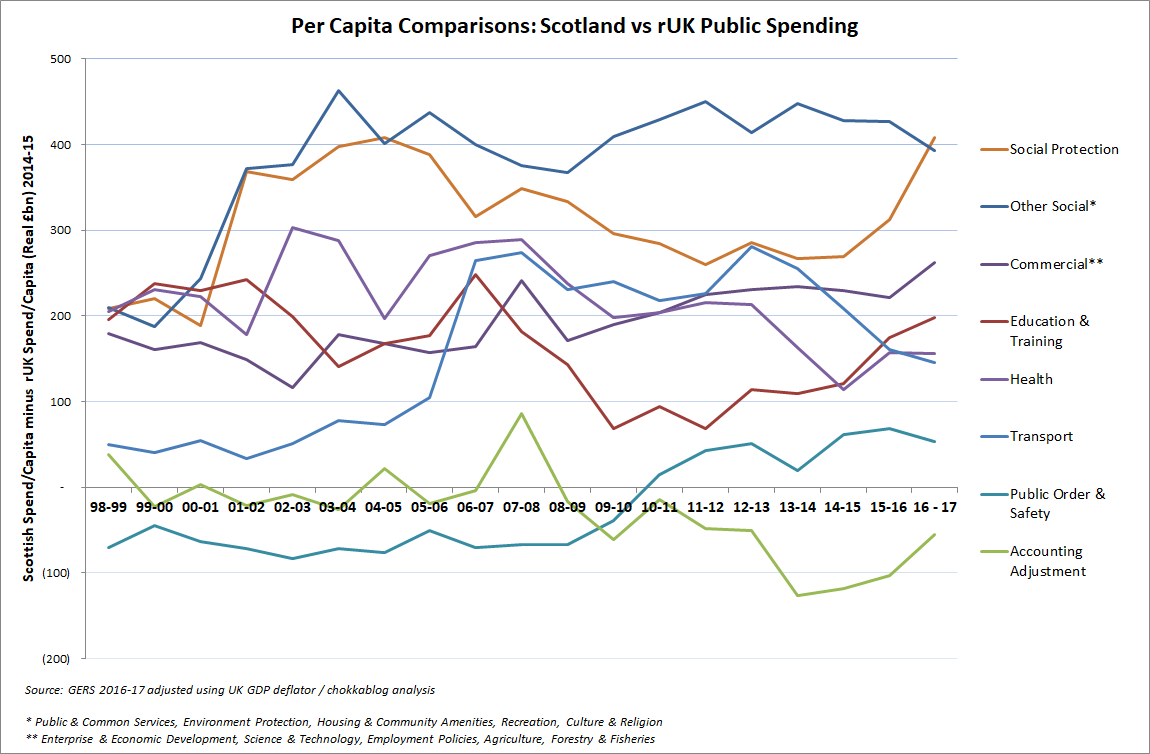
The simple answer is basically "everywhere". We used to spend less per capita on
Public order & Safety, but the centralisation of Police Scotland appears to have put paid to that. There has been a long overdue - but to be applauded - marked increase in Education and Training spend. Social Protection appears to have (relatively) increased dramatically - I'm not sure what's driving that.
Last year when looking at this figures I said "So we can see where we spend more and this adds up in total to £1,300 per capita (presumaby it will be more if ONS decide Scottish Housing Associations should also be classified as public expenditure)". Sure enough that's exactly what has happened (again: GERS previously erred on the side of generosity to Scotland) so the revised figure for 2015-16 if £1,419 and this year the figure is £1,566 per capita higher public spending in Scotland.
If we're to close the deficit gap - to reduce our dependence on Barnett - we could of course simply spend less. The figures above give you a starting point to try and find £10bn. Suffice to say a £10bn reduction in spend would be an order of magnitude greater than any cuts we've seen under "Tory austerity".
For "fun" I went through the following exercise to illustrate how hard it would be to reduce Scottish public spending by £10bn (or 14%). Starting with the spending category where Scotland’s spending premium is highest in per capita terms, the following list shows what Scotland’s higher per capita spending amount was in 2016/17 and what percentage budget cut would be required to take that to zero, to be at the same level as the rest of the UK average:
If we're to close the deficit gap - to reduce our dependence on Barnett - we could of course simply spend less. The figures above give you a starting point to try and find £10bn. Suffice to say a £10bn reduction in spend would be an order of magnitude greater than any cuts we've seen under "Tory austerity".
For "fun" I went through the following exercise to illustrate how hard it would be to reduce Scottish public spending by £10bn (or 14%). Starting with the spending category where Scotland’s spending premium is highest in per capita terms, the following list shows what Scotland’s higher per capita spending amount was in 2016/17 and what percentage budget cut would be required to take that to zero, to be at the same level as the rest of the UK average:
- Social Protection (including pensions): £408/capita, equivalent to a 9% spending cut
- Education & Training: £199/capita (13%)
- Housing & Community Amenities: £164/capita (53%)
- Health: £156/capita (7%)
- Transport: £146/capita (25%)
- Agriculture, Forestry and Fisheries: £120/capita (63%)
- Enterprise & Economic Development: £113/capita (59%)
- Public & Common Service: £87/capita (31%)
- Recreation, Culture & Religion: £84/capita (33%)
- Public Order & Safety: £54/capita (11%)
If we cut all of those budgets by these amounts we’d save £1,531/capita. Add that to the White Paper’s optimistic £111/capita saving (mainly from the allocated defence budget) and you’ve got a £1,642/capita or £8.9bn saving versus the 2016-17 GERS figures. So still doesn't quite get us there!
So let's look at the other side of the equation, our onshore revenue generation

This shows a very encouraging real-terms growth trend which is in-line with the UK as a whole.
Now you either see this as showing that Westminster's economic policies work for Scotland as well as they do for the rest of the UK or (if you aren't too busy arguing that GERS numbers show us nothing of value) that they show what a super job the SNP are doing. Given the SNP have refused to use our hard-fought-for tax raising powers to any meaningful degree, I find it hard to conclude that this is anything other than the UK's economic strategy working for Scotland's onshore economy.
Now I imagine you'll be wanting to know why we consistently generate less revenue per capita than the rest of the UK, so let me throw one last graph at you:
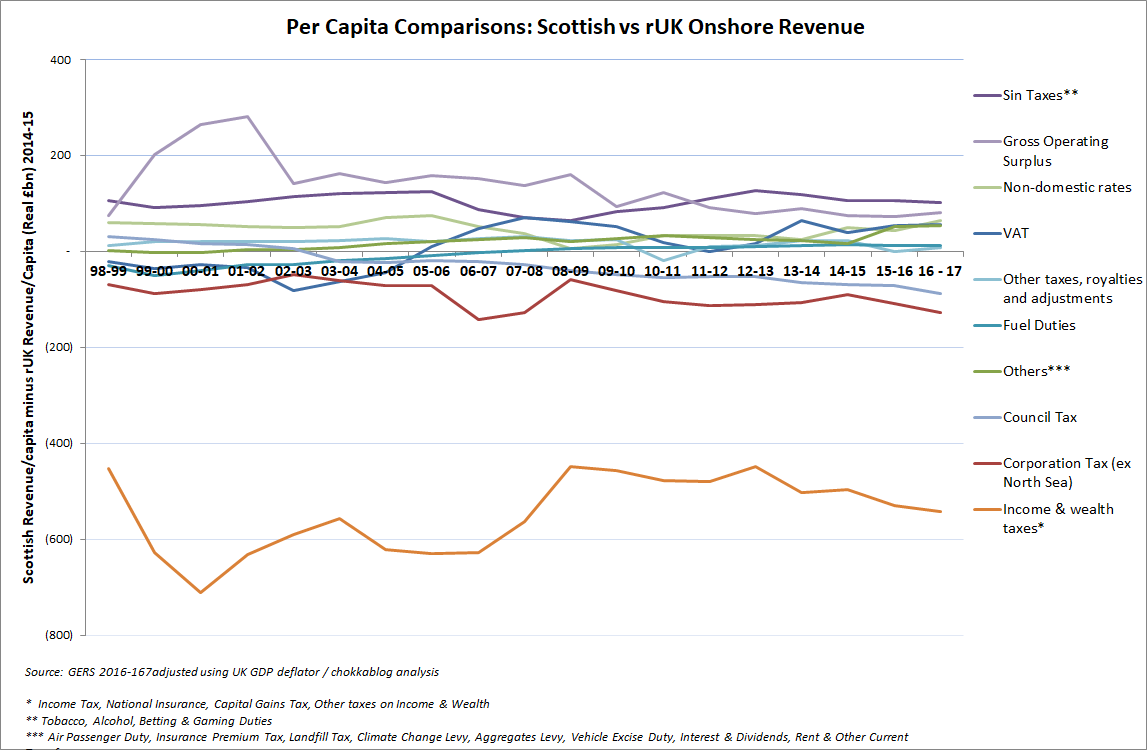
As noted before on this blog, we depressingly raise more per capita in sin taxes (tobacco & alcohol duties) and the corporation tax assumption is the one big "punt" in GERS: companies don't report profits split between Scotland and rUK so it's frankly a guess. The key point is that this guess is not a material factor in explaining the lower revenue generation we see - that's clearly down to lower income and wealth taxes. Basically, on average Scots are paid less and we are less wealthy than the average of the rest of the UK (but certainly not more than all other UK regions, to be clear).
****
So I think we've understood the GERS figures through these graphs and they produce no surprises. If we'd have voted Yes the oil decline would still have happened and the gap that is being filled by fiscal transfers from the rest of the UK would have to have been filled from elsewhere - some combination of spending reductions, tax rise or even higher borrowing. That's before we even start to consider the immediate cost of independence, currency issues, business flight etc. We can safely conclude that those of us who voted No helped us dodge a bullet.
Even Yes voters can't deny that we now receive an effective £10bn fiscal transfer from the rest of the UK, that pooling and sharing works massively in our favour.
The question remains: how do we improve the economy of Scotland, how do we deliver not only onshore revenue growth in-line with the rest of the UK but revenue growth that's superior to the rest of the UK? Only by answering this question can we reduce the fiscal transfer without drastically cutting our public spending.
***************************************************
Notes
1.As with every GERS release there have been some adjustments made to prior year figures
2. The EU uses a slighty different deficit definition than that in GERS, but it's not significant in this context
3. Actual North Sea revenues were £208m for Scotland and £(124)m for rUK (presumably due to decommissioning tax relief)
4. per GERS page 3: "Non-North Sea revenue in Scotland grew by 6.1% in 2016-17, similar to that for the UK
as a whole, 6.2%"
5. I produced this graph way back when 2013-14 were the most recent figures available - I think it stacks up pretty well compared to how things have panned out


